
Table of Contents
Figures
Figure 1 (Page 2) – Map of the portion of Meanwood Beck where data was gathered.
Figure 2 (Page 3) – First site where data was collected.
Figure 3 (Page 4) – pH readings at the three measured locations.
Figure 4 (Page 5) – The second site where we collected data.
Figure 5 (Page 6) – Turbidity readings at the three measured sites.
Figure 6 (Page 7) – Third Site where data was collected.
Figure 7 (Page 8) – Temperature readings at the three different sites
Figure 8 (Page 9) – Oxygen Reduction Potential at the three different sites.
Figure 9 (Page 12) – Drainage basin of Meanwood Beck. Source: Environment Agency.
Figure 10 (Page 13) – Map outlining recommended monitoring points.
Technical Summary
The report from Meanwood Beck found that the oxygen reduction potential (ORP) was lower than expected for a healthy river. The ORP should be around 300 to 500 mV, compared to the 94 to 120 mV measured. A low ORP reading means the beck finds breaking down waste in its water course harder as the bacteria consumes most of the oxygen at the cost to other species in the ecosystem. Other than ORP, all other readings taken at Meanwood Beck were pH, electric conductivity, and turbidity measurements, as expected. This data suggests that there may be some pollution in the Beck, which may be from surface runoff from local city roads, leaching chemicals and nutrients from farmland in the drainage basin, or the release of sewage into the water course. Data from the Rivers Trust makes it clear that there are sewage releases into Meanwood Beck throughout the year, with a little over 1,000 hours of estimated sewage releases from 305 individual releases on the Beck upstream of our study area in 2023. Sewage releases and urban runoff have increased the concentration of phosphates in the Beck, limiting plants’ growth as it makes other nutrients less available. Furthermore, small phosphate increases promote algae growth, reducing the sunlight available for plants underwater.
Introduction
This report focuses on Meanwood Beck, a 15.995 km tributary of the River Aire located in Leeds, West Yorkshire (Environment Agency, 2023). Meanwood Beck flows southeast through the city and joins the River Aire, a significant river in the region, at the Royal Armouries after passing through the developed urban landscape of the city centre and the urban parklands in the northwest of the city.
Multiple sources of pollution, such as urban runoff, industrial discharges, agricultural practices, and wastewater releases, pollute urban watercourses. Of these sources of pollution, it is know that urban runoff, agrarian discharge, and wastewater release are all factors that will contribute negatively to the health of the watercourse.
Significant media attention has been focused on the United Kingdom’s water courses over the past five years as the extent to which water companies release untreated sewage into the country’s waterways has become more apparent. As a result, monitoring water courses around the United Kingdom is of great importance; when sewage enters a river system, it causes severe damage to the ecosystem, particularly the oxygen levels, which can lead to mass die-offs (Oxford University, 2023).
For this report, six different pieces of data were collected at three locations along half a kilometre of Meanwood Beck (see Figure 1). Collecting data at various locations along the Beck was critical in assessing the ecosystem’s health and the benefits of conservation. The ability to identify any changes in readings along the Beck, allows us to narrow down the reason for such changes, for example, a joining pipe or stream.

Figure 1 – Map of the portion of Meanwood Beck where data was gathered. Source: Google Maps
Purpose
This report aims to measure Meanwood Beck’s health to better support the region’s water resource management and environmental conservation.
Results
The data for this report was collected in one day, November 21st, 2024, as the United Kingdom was experiencing frequent large weather events that would have greatly affected the data collected. Large storms would have greatly increased the Beck’s discharge and affected our readings.
Site 1
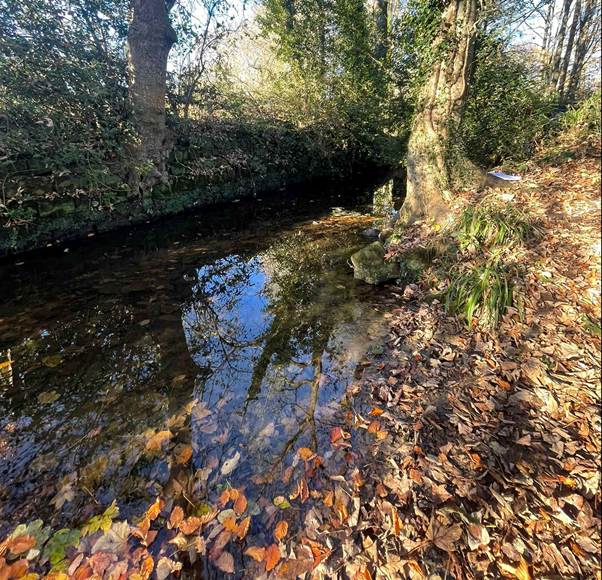
Figure 2 – First site where data was collected.
Site one was set 15 to 20 meters from the main footpath towards Meanwood Park in an area of mature trees and a reasonable level of ground plants. Compared to the other sites, the Beck flows relatively fast, 0.3 m/s, on the far-left side next to the steep bank and slower on the shallower righthand side, 0.1 m/s, as it usually does when flowing around a meander in a watercourse (Kauffman, 2018).
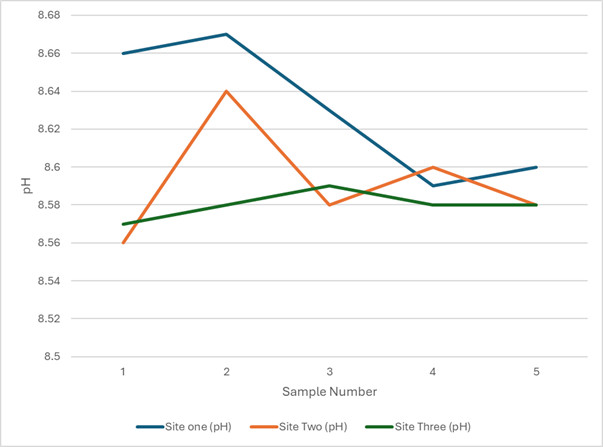
Figure 3 – pH at the three measured locations.
Site one was most notable for having a higher pH on all but one sample compared to the other two sites. There is one fundamental difference between site one and the others: site one has a larger number of plants, which adds stability to the banks of the Beck, therefore locking in more minerals and nutrients from being leached out from heavy rainfall (Narutal Resources Conservation Service, 2011).
Site 2

Figure 4 – Second site where data was collected.
The second site was inside Meanwood Park, a few metres from a main footpath running East to West near a small weir just below Figure 4. This caused the Beck’s flow to reduce significantly to the point where our flow meter struggled to register any movement. Furthermore, site two has the lowest average turbidity reading of all sites at 1.61 FNT, compared to 1.91 and 3.734 at sites one and three, respectively, which means all sites have ‘low’ turbidity (Data Stream, 2024). I also think turbidity readings were lower at site two because the banks of the Beck were covered in stone bricks, presumably by the local council, in order to reduce embankment erosion, which reduces the amount of sediment that enters the watercourse.

Figure 5 – Turbidity readings at the three measured sites.
Site 3
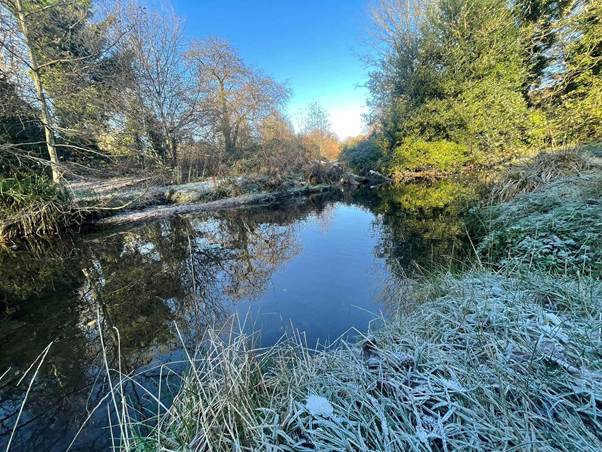
Figure 6 – Third Site where data was collected.
Site three was on a slow-moving meander in the Beck northwest of site 2. Of the five flow rate recordings that were taken at this site, only one registered a reading of 0.1 m/s. The rest read as zero, as this was because the gathered readings were on the inner side of the meander, the slower side, and unsuitable gear prevented further readings from being taken in the middle of the Beck (Kauffman, 2018).

Figure 7 – Temperature readings at the three different sites
The largest difference in readings was with temperature, which, although taken on the same day, read lower across all five samples. Site three was colder than the others because the water in this area was much deeper than in others, allowing greater circulation of colder water below the warmer surface layer, creating a small convection current that could not be made at other sites as they were not as deep. Furthermore, moving water interacts with the atmosphere more, becoming closer matched to its temperature, which on November 22nd was around 4 to 7°C (Climate Data, 2024).
Overall, this research showed that Meanwood Beck is healthy when looking at certain metrics, showing good results for pH, electrical conductivity, flow, and turbidity.
Of all the data collected from the three sites along Meanwood Beck, the most surprising result was from the Oxygen Reduction Potential (ORP), which was significantly lower than expected at 98 to 118 mV compared to around 300 to 500 mV for a ‘healthy’ watercourse (DataStream, 2024). High Oxidation-Reduction Potential means that the natural bacteria in the water can easily decompose dead tissue and contamination that it would if the ORP was lower.

Figure 8 – Oxygen Reduction Potential at the three different sites
So why is the oxygen level in the beck low? There are several reasons for low oxygen. For example, temperature plays a big role, as colder temperatures can store a higher proportion of slower-moving oxygen molecules than warmer temperatures (Cyfoeth Naturiol Cymru Natural Resources Wales, 2023). Another factor is the flow rate of the water, as faster-moving water is more turbulent and prone to aeration when flowing over rocks, particularly in the upper courses of a river (Queen Mary University London, 2024). However, Meanwood Beck does not have a ‘usual’ profile as the source of the Beck is in an area of undulating farmland only around 10km from where the data was gathered, so there are no white waters that may be seen on other river courses that would provide a good source of oxygen. Furthermore, the Beck area where measurements were conducted had slow-moving water that only registered on our flowmeter at 0.1 m/s.
Drainage pipes can be seen in multiple places along the Beck leading from surrounding streets, leading to pollution from urban runoff, which is a major source of pollution for urban watercourses around the world (Alexandra Muller, 2020).
High concentrations of phosphates can reduce the ORP reading (New Hampshire Department of Environmental Services, 2019). Sources of phosphates can be natural or anthropogenic. Natural sources are atmospheric deposition, weathering of geological phosphate material and the decomposition of biomass. Anthropogenic sources are fertilizer, pet waste, agricultural and urban runoff, and untreated wastewater, all of which could be an attribute to the health of Meanwood Beck, with known urban and agricultural land inside the Beck’s drainage basin (New Hampshire Department of Environmental Services, 2019). Slight increases in phosphates in water can promote large buildups of algae, which reduces the availability of sunlight for other aquatic plants underwater. However, during our visit, there were no visible algae on the water; this is because the visit, in November, was during late autumn or early winter, a period of time when little algae grows due to temperatures and less intense light.
At the time of research, there had been lots of heavy rain, and some snowfall discharge from the Beck was higher than average, according to the environmental agency. Therefore, there is a high chance that sewage had recently been discharged into the Beck or occurred during our visit. This would explain why there was such a large difference in the ORP to that of a “healthy river”, given that all our other data indicated that the watercourse was healthy. Furthermore, raw sewage has a pH of around 7.5 to 8.5, the level observed along the Beck, making the idea that sewage is the cause of low oxygen more promising.
Improvements
If this report were to be conducted again with similar constraints and deadlines, I would make sure appropriate equipment was available to deal with some of the challenges that can be encountered. For example, during the study, the water temperature was around 1 to 3 °C, making it difficult in some circumstances to gather data when the Beck got deep. This caused the person carrying out the monitoring to be in some discomfort when collecting data.
Conclusion
The result of this investigation shows that Meanwood Beck is dealing with some environmental problems, mainly from a lower oxygen concentration, which is occurring as a result of anthropogenic pollution entering its waterways from the farmland around the source of the Beck and from the urban area of Leeds in its drainage basin. The primary pollution culprit is probably raw sewage released into the Beck during heavy downpours. The raw sewage is packed with bacteria, which, when it enters the water, consumes large amounts of oxygen for respiration to the detriment of other plants and animals in the ecosystem. Other metrics for the health of the watercourse would indicate that Meanwood Beck is healthy, with a pH of around 8.55 and electric conductivity at 0.5 Ms.
If Meanwood Beck wants to remain an important area of nature and conservation in one of the United Kingdom’s largest cities, the local authorities need to address the issue of sewage releases into its waters; otherwise, larger ecosystem damage will occur as a direct result of low oxygen which is essential to many species.
Suppose authorities are serious about conservation in the Meanwood Beck area. In that case, they will have to address the issue of untreated wastewater entering the Beck and reduce the quantity of urban runoff that ‘has to’ enter the watercourse during heavy rain.
However, this is an issue that needs to be brought up with the central government as sewage releases are not illegal in the United Kingdom, depending on the conditions (Government of the United Kingdom, 2023). Therefore, if you want the environmental conditions of Meanwood Beck and the 86% of England’s rivers and lakes that are not classified as having ‘good ecological status’ to improve, you have to start at the top (Environmental Agency, 2024).
The simple but costly solution to mitigate this issue is to invest heavily in the sewage and wastewater treatment network. However, recent media reports of the financial difficulties that water companies in England cast doubt on whether sufficient capital is available to make the changes. Therefore, other methods need to be considered, like reducing the volume of water that enters the Beck and reducing the speed at which it enters during periods of high precipitation. Ways to do this include restoring forests and marshlands in the drainage basin as well as using some Sustainable Drainage Systems (SuDS) by creating retention ponds and detention basins to withhold excess water for slow release back into the Beck when levels are lower (The Flood Hub, 2021). When water is held in these, and some aquatic plants are present, some pollutants that may get washed off from the urban area will be absorbed and prevented from entering the water course, which will help improve its quality. However, as with most developments, SuDS comes at a cost that may not be feasible for the local communities but, on average, is 10% cheaper than traditional drainage infrastructure (susdrain, 2023).
Future Monitoring
A larger monitoring program of the whole watercourse is needed to understand Meanwood Beck’s environmental condition substantially. This monitoring program would have to take place over the course of a year, as we know that temperature and sunlight will change aspects of our results, like oxygen availability. Furthermore, turbidity will reduce as summer approaches due to reduced rainfall and erosion.
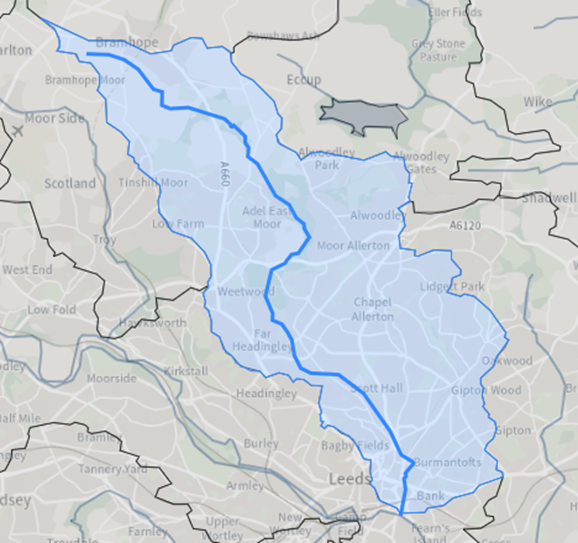
Figure 9 – Drainage basin of Meanwood Beck. Source: Environment Agency
For an enhanced report to better understand the environmental state of the Beck, we will need multiple measurements taken once every week or, even better, every day at various locations along the Beck. This will give us a great overview of how the Beck changes through the seasons and weeks of the year.

Figure 10 – Map outlining recommended monitoring points.
Figure 10 outlines locations along Meanwood Beck that should be used for a more exhaustive monitoring program. Each location has a reason for monitoring to take place there.
Reasons for each location:
9. It is at the exit of a large park and nature reserve surrounded by farmland. This will be taken as the Beck’s most ‘natural’ condition and will be used to compare it to the readings in the centre of the city.
8 to 6. These sites are located in extensive woodland that runs between the suburbs of Adel, Wharfedale, and Alwoodley as it enters the urban area of Leeds.
5 to 3. This area is one of Leeds’s most densely populated suburbs, and there are known wastewater release pipes into the water.
2. This location is right before the Beck enters the more industrial part of northern Leeds, with multiple large buildings and businesses along its banks.
1. This is one of, if not the last, locations from which the Beck can be accessed before joining the River Aire. It will serve as the final reading to determine the amount of possible pollution that has entered the Beck since its source.
This project will give an excellent overview of the broader state of the Beck over the course of a year and will be able to answer questions like at what times during the year is the Beck at its most polluted? In which section of the Beck is the most polluted?
Therefore, with more time and enhanced resources, a more detailed description of the location and wider implications of pollution in Meanwood Beck.
References
Alexandra Muller, H. O. J. M. M. V., 2020. The pollution conveyed by urban runoff: A review of sources. Science of The Total Environment , Volume 709.
Climate Data, 2024. Leeds Weather In November. [Online]
Available at: https://en.climate-data.org/europe/united-kingdom/england/leeds-107199/t/november-11/
[Accessed 14 December 2024].
Cyfoeth Naturiol Cymru Natural Resources Wales, 2023. Dissolved oxygen in water, Cardiff: Cyfoeth Naturiol Cymru Natural Resources Wales.
Data Stream, 2024. Turbidity. [Online]
Available at: https://datastream.org/en-ca/guidebook/turbidity
[Accessed 15 December 2024].
DataStream, 2024. Oxidation-Reduction Potential (ORP). [Online]
Available at: https://datastream.org/en-ca/guidebook/oxidation-reduction-potential-orp
[Accessed 14 December 2024].
Environment Agency, 2023. Meanwood Beck from Source to River Aire Water Body. [Online]
Available at: https://environment.data.gov.uk/catchment-planning/WaterBody/GB104027062900?cycle=3
[Accessed 14 December 2024].
Environmental Agency, 2024. World Rivers Day: What are the biggest causes of river pollution and what’s being done about them?. [Online]
Available at: https://environmentagency.blog.gov.uk/2024/09/22/world-rivers-day-what-are-the-biggest-causes-of-river-pollution-and-whats-being-done-about-them/
[Accessed 17 December 2024].
Government of the United Kingdom, 2023. General binding rules: small sewage discharge to the ground. [Online]
Available at: https://www.gov.uk/guidance/general-binding-rules-small-sewage-discharge-to-the-ground
[Accessed 17 December 2024].
Kauffman, R. B., 2018. River Dynamics, Frostburg: Frostburg State University.
Narutal Resources Conservation Service, n.d. Soil pH, Washington : United States Department of Agriculture.
New Hampshire Department of Environmental Services, 2019. Phosphorus: Too much of a good thing, Concord: New Hampshire Department of Environmental Services.
Oxford University, 2023. New study finds that sewage release is worse for rivers than agriculture, Oxford : Oxford University.
Queen Mary University London, 2024. Dissolved Oxygen, London: Queen Mary University of London.
susdrain, 2023. Comparisons of costs and benefits. [Online]
Available at: https://www.susdrain.org/delivering-suds/using-suds/the-costs-and-benefits-of-suds/comparison-of-costs-and-benefits.html
[Accessed 18 December 2024].
The Flood Hub, 2021. An Introduction to Sustainable Drainage Systems (SuDS), s.l.: News Ground .


+ There are no comments
Add yours